From the blog
How to Read Your Solar Proposal Without Being Overwhelmed
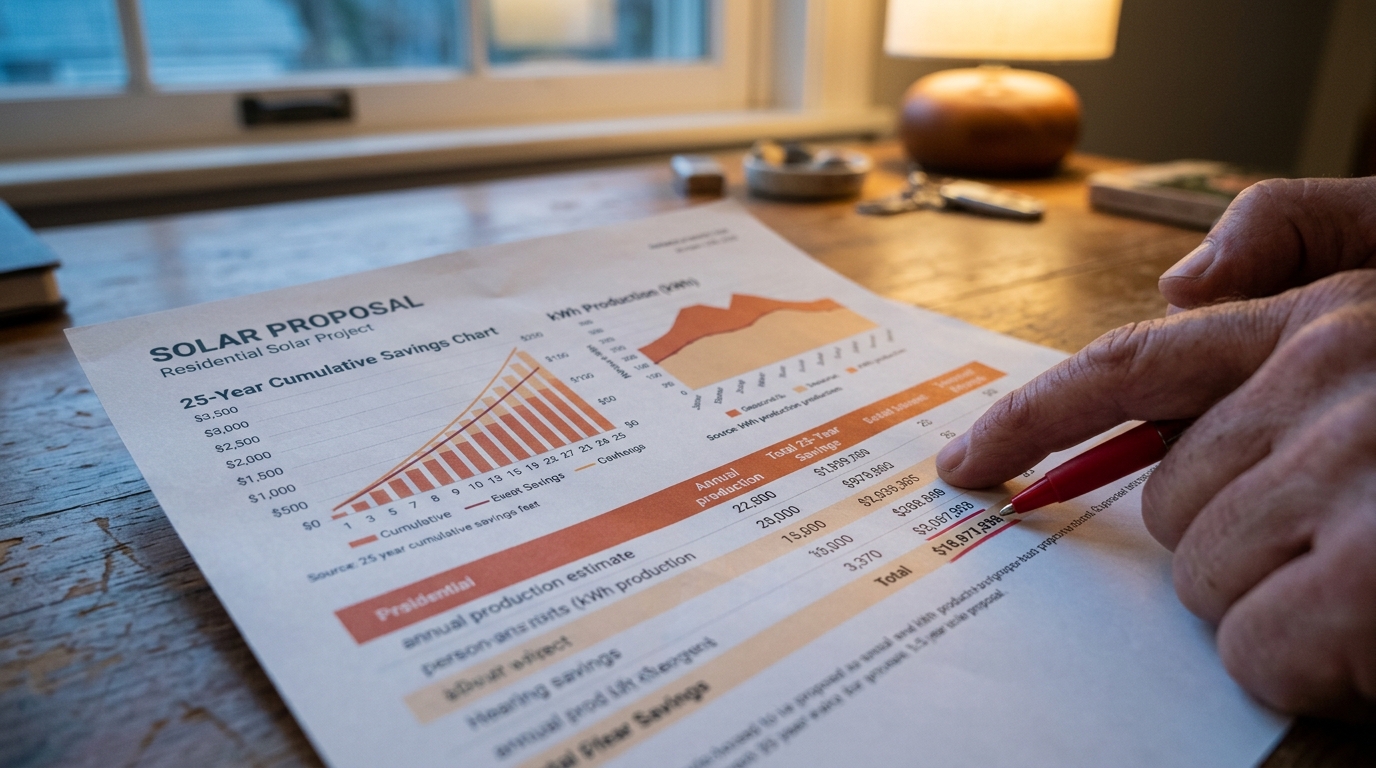
A solar proposal contains six key sections: system size, annual production estimate, offset percentage, equipment specs, financial terms, and warranty coverage. Master those six, and you can evaluate any proposal in under 30 minutes - regardless of which installer prepared it.
Most homeowners receive a solar proposal and feel an immediate wave of confusion. Pages of graphs, kilowatt-hour projections, 25-year savings charts, and acronyms like PBI, ITC, and SREC pile up fast. The good news: installers design these documents to be comprehensive, not necessarily readable. Once you know what each section actually means and which numbers matter, the document stops being intimidating and starts being a decision-making tool.
Section 1: System Size (kW) - The Foundation of Everything
The system size, measured in kilowatts (kW), tells you how much generating capacity is being installed. A typical residential system in 2026 runs between 7 kW and 14 kW, though high-consumption homes or those adding EV chargers often go larger.
What to check: Compare the proposed system size against your actual annual electricity consumption shown on your utility bills. Your installer should show this calculation explicitly. A 10 kW system in Phoenix produces dramatically more electricity than the same 10 kW system in Seattle - production depends on sun hours, not just panel count.
Red flag: Any proposal that leads with panel count ("you're getting 28 panels!") without immediately linking that count to your specific consumption data is prioritizing marketing over accuracy.
Section 2: Annual Production Estimate - Treat It as a Range, Not a Promise
Proposals state how many kilowatt-hours (kWh) the system will produce per year, typically modeled using software like PVWatts (from NREL) or Aurora Solar. These tools use decades of weather data to produce reliable estimates - but they are still estimates.
A well-crafted proposal will show production figures for each individual month, not just an annual total. Monthly breakdowns reveal whether your system is properly sized for winter months, when production drops by 30–50% in northern states.
Ask the installer: What weather dataset did you use, and what production degradation rate did you apply? Quality proposals use a degradation rate of approximately 0.5% per year - the industry standard for modern monocrystalline panels.
Section 3: Offset Percentage - What You're Actually Replacing
The offset percentage tells you what share of your current grid electricity the solar system will replace. A 90% offset means you'll still buy roughly 10% of your electricity from the utility. A 100% offset sounds ideal, but it often means the system is slightly oversized, and in many states you won't be compensated at full retail rate for the excess power you send back.
Target range: Most financial models work best at 80–100% offset. Going above 100% rarely makes financial sense unless you're adding a battery, an EV, or expecting significant household growth.
Section 4: Equipment Specs - Panels, Inverters, and Racking
This section lists the actual hardware. Here's what each component means and what to look for:
- Solar Panels: Look for panel efficiency (percentage of sunlight converted to electricity) and the brand's Tier 1 status. Leading panel brands in 2026 include Maxeon, REC Group, Jinko Solar, and LONGi. Efficiency ratings above 21% are strong for residential monocrystalline panels.
- Inverter: This converts DC electricity from panels into AC electricity your home uses. String inverters are lower cost but underperform if any panels are shaded. Microinverters (Enphase IQ8 series) and DC optimizers (SolarEdge) handle shade better and provide panel-level monitoring. Ask which type is proposed and why.
- Racking/Mounting: Often overlooked. The mounting system anchors panels to your roof. Iron Ridge and Unirac are two reputable brands. Cheap racking fails in high-wind or high-snow environments.
Section 5: Financial Terms - The Numbers That Actually Decide Your ROI
This is where proposals get genuinely complex. Here's a direct comparison of the most common financing structures:
Structure Who Owns the System You Receive ITC? Long-Term Value Cash Purchase You Yes (30% federal tax credit) Highest - full savings, full equity Solar Loan You Yes (30% federal tax credit) Strong - equity with monthly payments Solar Lease Installer/Third Party No Moderate - lower upfront, less savings PPA (Power Purchase Agreement) Installer/Third Party No Moderate - you pay per kWh producedThe federal Investment Tax Credit (ITC) currently stands at 30% of the total installed system cost. On a $28,000 system, that's $8,400 back at tax time - but only if you own the system outright via cash or a loan, and only if you have sufficient tax liability to claim it. Confirm this with your accountant before signing.
Also scrutinize the assumed electricity rate escalator- the rate at which the proposal assumes your utility's electricity prices will rise each year. A figure above 3–4% annually inflates long-term savings projections significantly. Ask what happens to the math if rates escalate at only 2%.
Section 6: Warranty Coverage - Three Numbers to Memorize
A complete solar proposal includes three distinct warranties:
- Panel Production Warranty: Guarantees panels produce at least a specified percentage of rated output over time. Industry standard is 90% at 10 years and 80% at 25–30 years.
- Panel Product (Materials) Warranty: Covers defects in manufacturing. Look for 12–25 years. Premium brands like Maxeon offer 40-year product warranties on select lines.
- Inverter Warranty: String inverters typically carry 10–12 years. Enphase microinverters carry a 25-year warranty. This difference matters - inverter replacement mid-system-life is a real cost.
Installer workmanship warranty covers roof penetrations and installation quality. A reputable installer offers at least 10 years on workmanship. Anything less is a negotiating point.
The Five Questions to Ask Before Signing Any Proposal
- What specific software and weather dataset did you use to generate the production estimate?
- What electricity rate escalation assumption drives the 25-year savings figure?
- Is the dealer fee (common in solar loans) included in the system cost shown?
- Who is the installing contractor - your company directly, or a subcontractor?
- What is the process and timeline if my roof needs repair after panels are installed?
Getting clear answers to all five separates confident installers from evasive ones. Any hesitation around question 3 - the dealer fee - warrants extra scrutiny. Solar loan dealer fees of 20–30% of the loan amount are common and dramatically affect your actual cost per watt.
A Quick Reference: Proposal Red Flags vs. Green Flags
- Red Flag: No monthly production breakdown - only annual totals.
- Red Flag: Offset percentage above 120% with no battery proposed.
- Red Flag: Electricity escalation rates above 4% per year.
- Red Flag: Warranty section shorter than one paragraph.
- Green Flag: Proposal includes your actual 12-month utility bill data.
- Green Flag: Line-item breakdown of equipment, labor, permits, and fees.
- Green Flag: Installer provides references in your zip code with verifiable reviews.
Reading a solar proposal critically isn't about distrust - it's about making a 25-year financial decision with the same rigor you'd apply to buying a house. The installers who present clean, transparent proposals welcome these questions. That reaction alone tells you a great deal about who you're working with.
What does kW vs. kWh mean in a solar proposal?
kW (kilowatt) measures the system's power capacity - how much electricity it can generate at any given moment. kWh (kilowatt-hour) measures actual energy produced or consumed over time. A 10 kW system running at full capacity for one hour produces 10 kWh. Your electric bill charges you for kWh consumed, so production estimates in proposals are always stated in annual kWh.
Is the 30% federal solar tax credit still available in 2026?
Yes. The federal Investment Tax Credit (ITC) remains at 30% for residential solar systems installed in 2026 under the Inflation Reduction Act's extended timeline. You must own the system (cash purchase or solar loan) and have sufficient federal tax liability to claim the full credit. It is a credit against taxes owed, not a refund check.
How do I know if a production estimate is realistic?
Ask the installer which software generated the estimate (PVWatts and Aurora Solar are the two industry-standard tools) and verify it used actual shading analysis from satellite or drone imagery of your roof. Cross-reference the annual kWh estimate against NREL's PVWatts calculator using your address - it's free and publicly available. If the installer's number is more than 10% higher than PVWatts, ask for an explanation.
What is a solar loan dealer fee and why does it matter?
A dealer fee is an upfront cost that solar loan lenders charge installers - typically 20–30% of the financed amount - which installers almost always pass directly to the customer by inflating the system price. A $28,000 cash price can become a $35,000+ financed price once the dealer fee is baked in. Always ask for the cash price and the financed price separately, then calculate the real cost per watt for each option.
Should I get multiple solar proposals before deciding?
Get at least three proposals from licensed installers. Compare them on cost per watt (total system cost divided by system size in watts), not just total price or monthly payment. Two systems with the same payment can have dramatically different total costs, equipment quality, and warranty terms. Comparing proposals side by side using the six sections outlined in this post gives you a reliable framework for an apples-to-apples evaluation.