From the blog
How Much Does a Solar Installation Actually Cost in 2026?
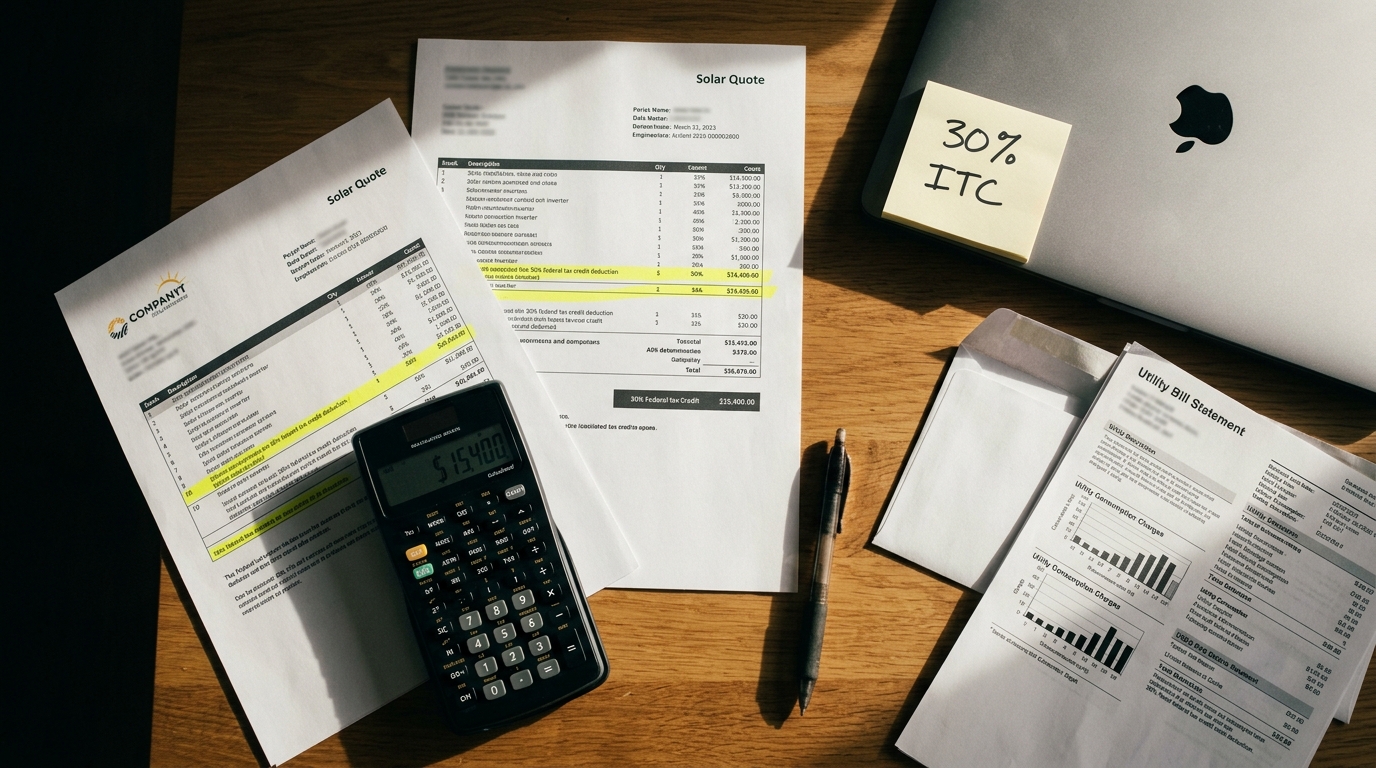
A residential solar installation in the United States costs between $15,000 and $35,000 before incentives in 2026, with the national average landing around $22,000 for a 8–10 kW system. After applying the federal Investment Tax Credit (ITC) of 30%, most homeowners pay $10,500 to $24,500 out of pocket. Those numbers have shifted meaningfully from prior years due to stabilizing panel prices, rising labor costs, and updated state-level rebate programs.
If you want a single, citable figure: the average cost per watt for a fully installed residential solar system in 2026 sits at $2.50 to $3.20 per watt, depending on your region, roof complexity, and equipment tier.
What Drives the Total Price of a Solar System?
Solar pricing is not a single number - it's the sum of five distinct cost categories. Understanding each one helps you evaluate quotes intelligently instead of just comparing bottom-line numbers.
- Solar panels (25–35% of total cost): Panel prices have stabilized after years of decline. Tier-1 monocrystalline panels from manufacturers like Jinko Solar, LONGi, and REC Group run $0.50–$0.80 per watt at the hardware level. Premium panels from SunPower (Maxeon) push higher.
- Inverters (10–15% of total cost): String inverters from SMA or Fronius cost less upfront. Microinverters from Enphase (IQ8 series) and power optimizers from SolarEdge add $1,000–$3,000 but improve performance on shaded or complex roofs.
- Racking and mounting hardware (5–10%): Standard pitched-roof installations use aluminum racking systems. Flat roofs, metal roofs, and tile roofs add complexity and cost.
- Labor and installation (25–35%): This is where regional variation hits hardest. Labor in California, New York, and Massachusetts runs significantly higher than in Texas, Arizona, or the Carolinas. A typical crew installs a residential system in 1–3 days.
- Permitting, interconnection, and soft costs (10–20%): Utility interconnection fees, local permits, and installer overhead account for a larger share of U.S. solar costs than in most other countries - a persistent inefficiency the industry continues to work on.
Solar Installation Costs by System Size (2026)
System Size Avg. Annual Output Gross Cost After 30% ITC Best For 5 kW 6,000–7,500 kWh $13,000–$18,000 $9,100–$12,600 Small homes, low usage 8 kW 9,600–12,000 kWh $20,000–$26,000 $14,000–$18,200 Average U.S. household 10 kW 12,000–15,000 kWh $25,000–$32,000 $17,500–$22,400 Larger homes, EVs 12–15 kW 14,000–18,000 kWh $30,000–$45,000 $21,000–$31,500 High-use homes, battery backupAdding Battery Storage: What It Costs in 2026
Battery storage is increasingly paired with solar, especially as grid reliability concerns grow and net metering policies have tightened in states like California (post-NEM 3.0) and Nevada. The Tesla Powerwall 3 and Enphase IQ Battery 5P are the two most commonly installed residential storage systems right now.
- Tesla Powerwall 3: 13.5 kWh capacity, installed cost of $12,000–$15,000 for a single unit
- Enphase IQ Battery 5P: 5 kWh per module, typically installed in 2–3 unit configurations, running $8,000–$14,000 depending on capacity
- Franklin Electric aPower 2: A growing competitor, installed around $10,000–$13,000 for a 13.6 kWh unit
Battery systems also qualify for the 30% federal ITC when paired with solar - and in some states, separate battery incentives stack on top of that.
Solar Costs by State: The Spread Is Wide
Where you live changes your final price by as much as 40%. Here's a realistic snapshot of installed costs before incentives, based on 8 kW systems:
- California: $23,000–$30,000 (high labor, strict permitting)
- Texas: $18,000–$23,000 (no state income tax credit, but low labor costs)
- Florida: $18,000–$24,000 (strong solar resource, competitive installer market)
- New York: $22,000–$28,000 (offset partially by NY-Sun Megawatt Block incentives)
- Arizona: $17,000–$22,000 (excellent irradiance, efficient permitting)
- Massachusetts: $24,000–$31,000 (high soft costs, but SMART program adds ongoing payments)
Financing Options: Cash, Loan, Lease, or PPA?
How you pay for solar changes your total cost and your long-term return dramatically.
- Cash purchase: Highest upfront cost, best long-term ROI. Payback periods in 2026 typically run 6–10 years depending on location and utility rates.
- Solar loan: $0 down, you own the system and claim the ITC. Interest rates on specialized solar loans currently range from 5.9% to 9.9% APR, depending on credit score and lender.
- Solar lease: Fixed monthly payment, no ownership, no tax credit. Simpler, but you leave significant savings on the table over 25 years.
- Power Purchase Agreement (PPA): You pay per kWh generated, usually at a rate below your utility's price. Works well for homeowners who can't use the tax credit (e.g., low tax liability).
What's the Payback Period in 2026?
With U.S. residential electricity rates averaging $0.17–$0.24 per kWh across most markets (higher in California, Hawaii, and the Northeast), solar payback periods have compressed. A properly sized system in a high-irradiance state like Arizona or Texas pays back in 5–7 years. In lower-sun states like Minnesota or Oregon, expect 9–12 years. System warranties from Tier-1 manufacturers now guarantee 90% output at 25 years, meaning you collect 15+ years of essentially free electricity after breakeven.
How to Get an Accurate Quote
Get at least three competing quotes. Use the U.S. Department of Energy's homeowner solar guide to understand what a legitimate proposal should include. Key line items every quote must show: system size in kW, annual production estimate in kWh, panel and inverter make/model, warranty terms, and the specific incentives applied. Reject any quote that bundles everything into a single number without itemization.
The National Renewable Energy Laboratory (NREL) publishes annual cost benchmarks that give you a solid baseline for comparison - use them to validate whether a quote is in range for your region.
Solar Installation Cost 2026 FAQ
What is the average cost of solar installation in 2026?
The national average for a fully installed residential solar system in 2026 is approximately $22,000 for an 8–10 kW system before incentives, or roughly $2.50–$3.20 per watt. After the 30% federal Investment Tax Credit, the average net cost drops to around $15,400.
Does the 30% federal solar tax credit still apply in 2026?
Yes. The Investment Tax Credit (ITC) at 30% remains in effect through 2032 under the Inflation Reduction Act. It applies to the full installed cost of solar panels and, when paired with solar, battery storage systems. You must have sufficient federal tax liability to use it directly; otherwise, consult a tax advisor about carryforward options.
Is it worth adding battery storage to a solar system?
In most cases, yes - especially in states where net metering has been reduced (California, Nevada, Arizona) or where grid outages are frequent. Battery storage adds $8,000–$15,000 to system cost but qualifies for the same 30% ITC and provides backup power and additional bill savings during peak rate hours.
How long does a solar installation take from contract to completion?
From signed contract to system activation, expect 2–4 months in most U.S. markets. The installation itself takes 1–3 days. The rest of the timeline is consumed by permitting (2–6 weeks) and utility interconnection approval (2–8 weeks), which varies significantly by municipality and utility company.
What questions should I ask a solar installer before signing?
Ask for the specific panel and inverter models, the projected annual kWh production, how the production estimate was calculated (ideally using PVWatts or equivalent), who handles permitting and utility interconnection, the warranty terms for equipment and workmanship separately, and whether the installer is NABCEP-certified. Any installer unwilling to provide itemized answers to these questions is a red flag.